6 Incredible Features of Meraki Dashboards

Remote work, hybrid work, and the irrelevance of physical locations are all factors affecting network teams. Businesses are demanding more from the corporate network with every passing month. The perimeter security model associated with physical data centers and branch offices is dead.
The new network is about anywhere and anytime access to applications. Network operators need a way to keep up — and Cisco Meraki is making this possible with a few stellar network management features. Some of them include:
Application performance indicator
User-focused application health
Wired WAN monitoring
Wireless WAN monitoring
Smart root-cause analysis
Actionable alerting on insight data
Want to Learn How to Use Cisco Meraki?
More organizations are relying on the cloud for their infrastructure needs. The need for IT pros who can implement and maintain Cisco Meraki networking solutions in cloud environments is increasing.
If you need to learn how to leverage Cisco Meraki, look no further than CBT Nuggets. We have a variety of Cisco Meraki training that covers everything from implementing Cisco Meraki switches to automating Meraki networks. Trainer Knox Hutchinson’s Cisco Meraki Networks training course is a great starting point for those who a new to Meraki.
Start a 7-day free trial to start watching Knox’s course and get a feel for what it’s like to train with CBT Nuggets.
1. Application Performance Indicator
The most powerful features for a network management system are the ones focused on exactly what your users care about. In today’s web-based world, increasingly this means web application performance. Traditionally, network management systems and application performance monitoring were two completely different systems. IT departments would purchase entirely different products for each of these functions and even dedicate two different teams of support technicians to monitor and manage them.
Cisco Meraki is bringing application performance management right to the network management layer, in an effort to drive real-time insights and corrective actions for network operations teams. It’s called web application health, and it’s part of Meraki insight.
The first feature of web application health is the performance indicator, which is a Meraki Insight dashboard containing a set of applications you choose to collect statistics about. These could be common Software-as-a-service products (SaaS), like Salesforce, the Microsoft Office suite, an ERP system, or accounting software. The performance indicator shows you at-a-glance status information about these applications, like this:
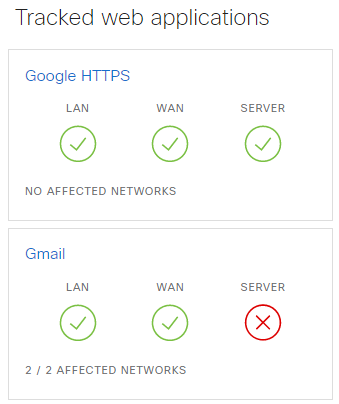
This indicator dashboard is super useful because it can tell you exactly which applications are failing, how badly they are failing, and why. It can be hard to determine the precise location of application connectivity issues. Performance indicator helps you narrow this down by showing you the application performance statistics from the user’s perspective and which network devices are involved with the user’s application experience.
You can also customize application monitoring parameters and thresholds or provide a custom application definition for apps you can’t find in the supported monitoring library or that are developed in-house.
2. User-focused Application Health
A second key feature of web application health is called per-network view. This dashboard allows you to drill into the statistics of application performance from your users’ perspectives. From this view, you can see the exact status of each of your applications from remote branch offices, data centers, wireless WAN locations, or home offices — as the end-user is experiencing them.
This is super helpful when narrowing down the scope of an issue, allowing you to focus your troubleshooting efforts on areas of significance instead of hunting for the problem randomly.
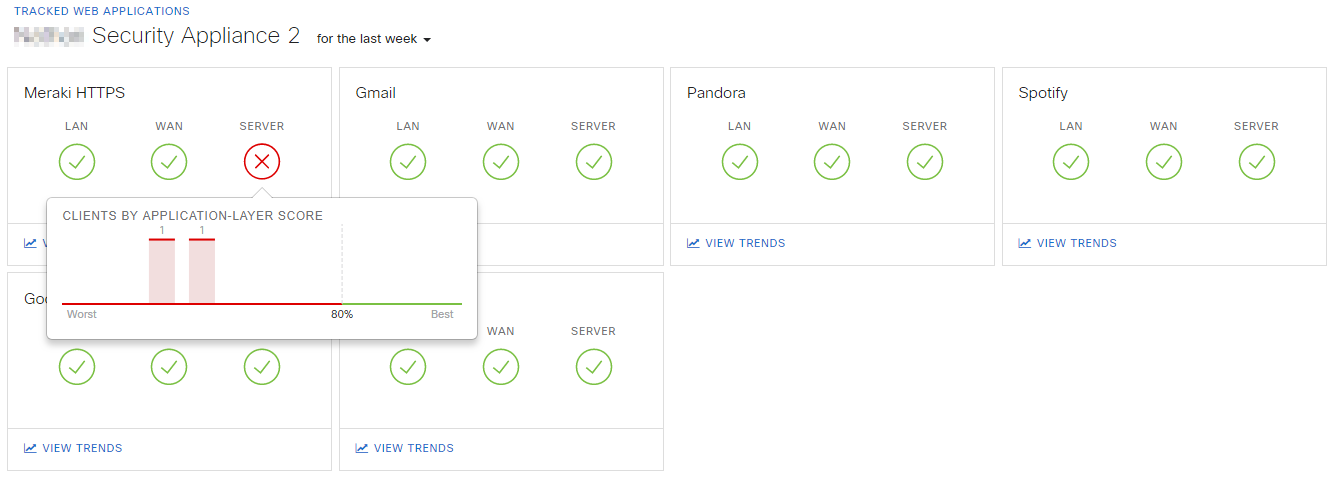
Detailed application analysis per-network
The dashboard provides a method for drilling into specific issues, at specific locations, for specific users, reducing the time to resolution for downtimes and outages. Additionally, the data aggregated in the web application health dashboard can be used to proactively monitor application performance and notify users of potential issues. Once an application is being monitored in Meraki insight, its performance is cataloged and scored over time, which you can see in the performance dashboard:

Web application health performance scoring
3. Wired WAN Monitoring
Network performance and usage insights are vital in today’s world of hybrid and remote work. The WAN health feature of Meraki Insight shows you at-a-glance usage and performance data for all of your WAN-connected devices. This includes teleworker gateways, branch office appliances, and LTE-connected failover modems. The WAN health feature is all you need to maintain a globally distributed network of offices, remote workers, retail stores, and more.
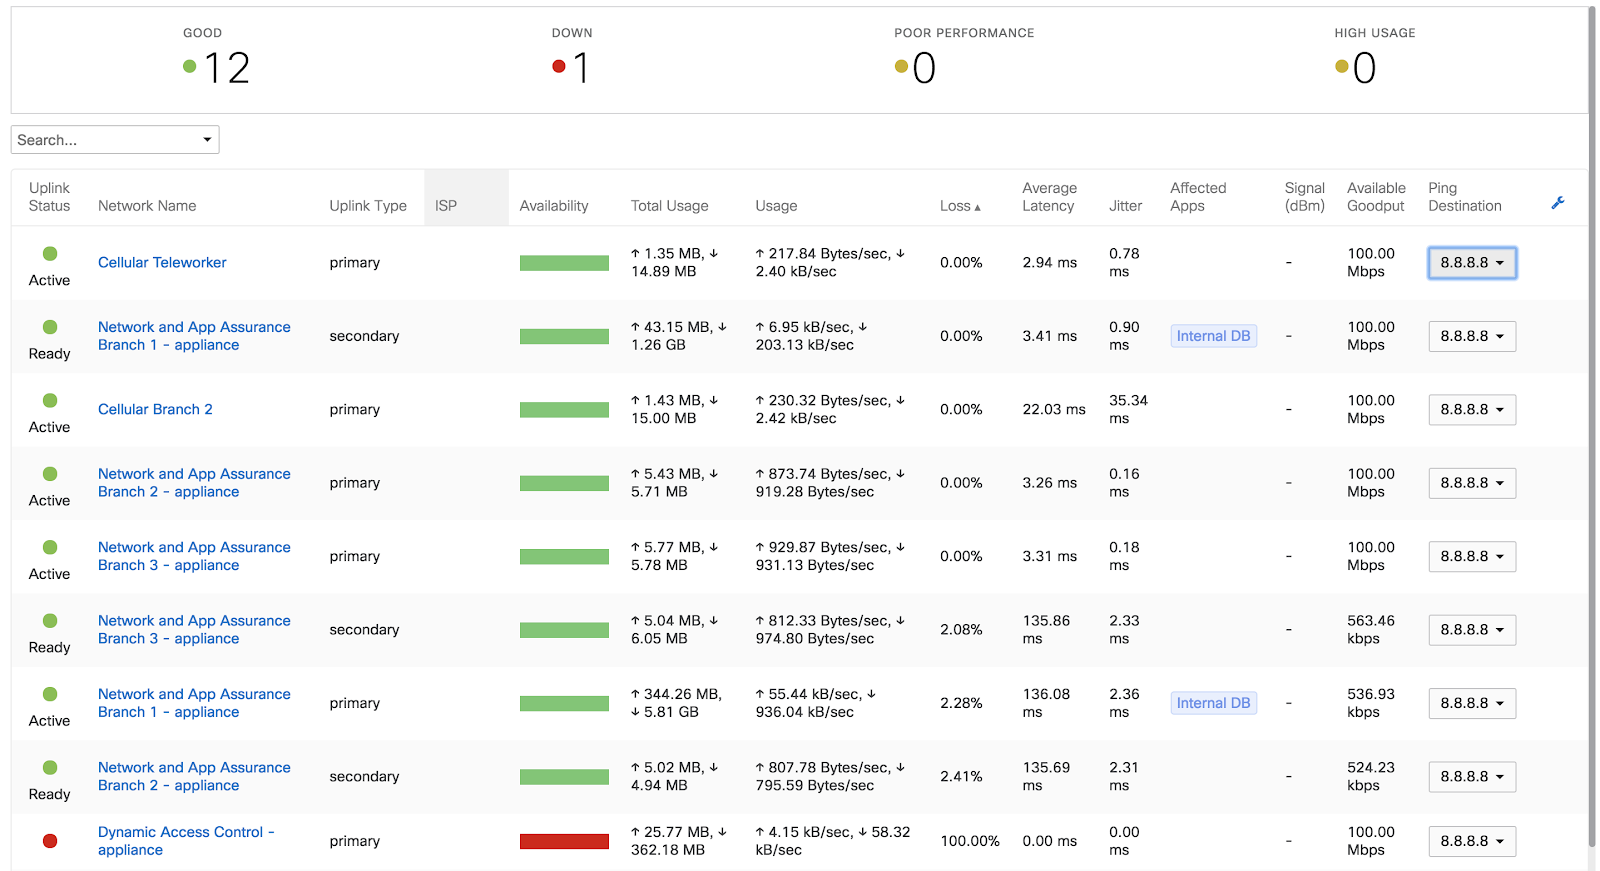
The Meraki WAN Health Dashboard
The WAN health dashboard allows you to drill into network specifics for each of your connected locations, including latency, throughput, packet loss, jitter, and more. These statistics can drive alerts, or provide quick feedback to engineers for troubleshooting. Because businesses are becoming more globally distributed, there are more routers and circuits to manage. Being able to see them all in one place is absolutely critical to maintaining stable infrastructure.
4. Wireless WAN Monitoring
The LTE analysis feature of Meraki Insight WAN Health provides the detailed status of cellular failover modems for geo-distributed locations relying on internet access for business operations. This is an ever-growing use-case for the Meraki cloud networking platform, as businesses are expanding to new locations, both urban and rural.
Devices and services living “at the edge,” or close to the end-users or machinery, are increasingly popular. The edge might be in a location where only cellular internet is available, like in a field or at a remote manufacturing location. The Meraki LTE analysis feature gives you all the same WAN health monitoring features for LTE-connected branches and edges as well.

LTE/Wireless WAN status
5. Smart Root-cause Analysis
There’s nothing worse than the pressure you feel when critical services are non-functional and your clients or coworkers are unable to do their jobs. The frantic searching for the problem and potential solutions always feels slower than it should be. Thankfully, Cisco Meraki includes a really smart tool to help you identify network problems in a way that focuses your efforts on the end customer.
Smart root-cause analysis consumes data from the WAN Health, and Web Application Health services on the Meraki platform and paints a picture of all the components involved with servicing your network locations and likely causes of active downtimes. The data is made available in the root-case analysis (RCA) dashboard:
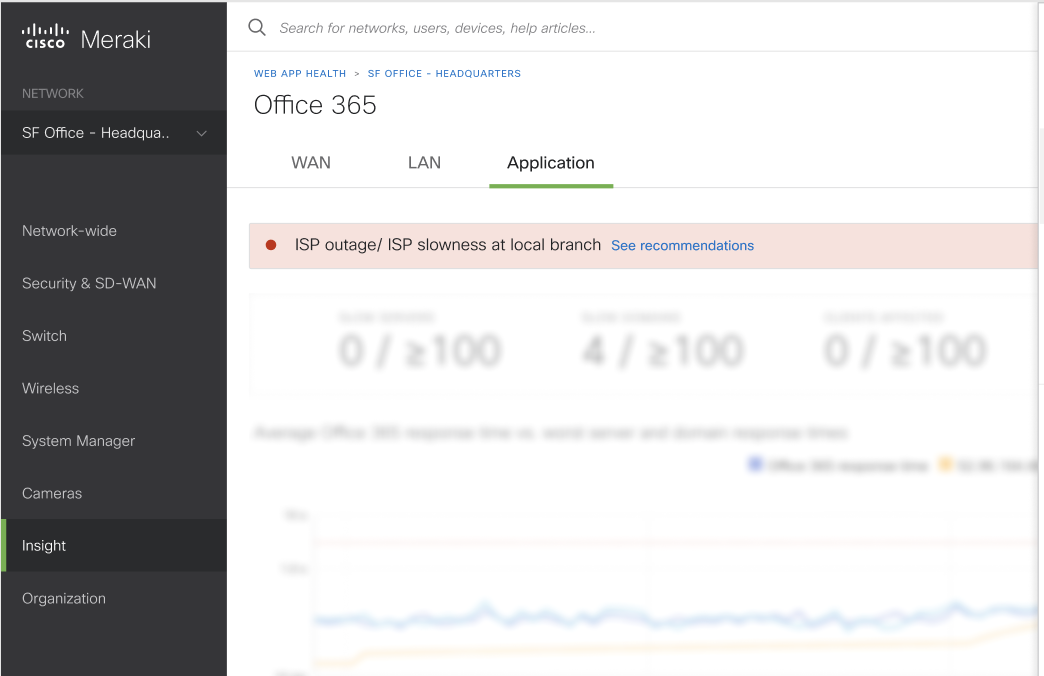
Meraki RCA dashboard
As you can see, the RCA feature has recognized that there is an issue with Office 365 accessibility at this branch location. In addition, it has been further identified that the issue is with the local ISP at the affected branch. This takes nearly all of the troubleshooting out of the equation. A network engineer receiving this report is now empowered to make a decision and carry on, instead of investigating where service connectivity is breaking down.
The RCA dashboard allows you to drill in further as well. You can click on the “see recommendations” link to drill into the identified issue and see a number of key points, including:
Root cause of the issue
The alert generated stating the app problem
The confidence in the root cause
The evidence that triggered the alert
Impact on clients
Recommended next steps Source – Meraki Documentation
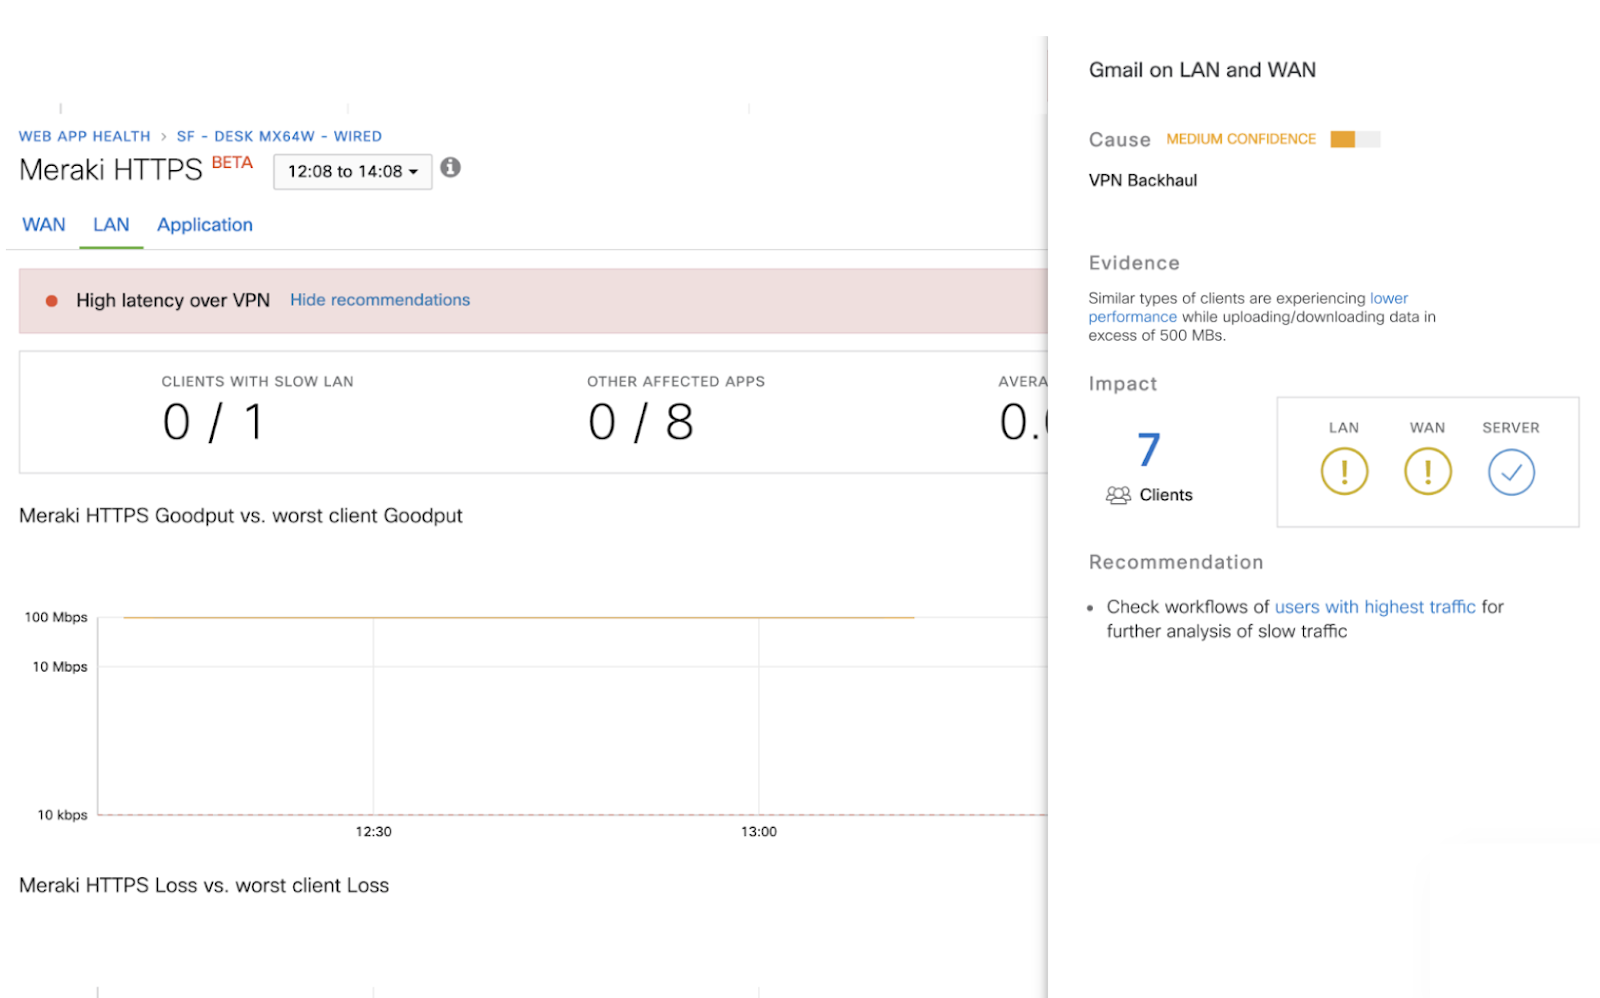
Client impact analysis with Meraki RCA
6. Actionable Alerting on Insight Data
Lastly, one of the most important features integrated with the release of Meraki Insight and RCA is Alert Hub, and smart alerts, powered by the RCA dashboard. Alert Hub is a centralized location for all alerts fired in the Meraki Insight system, across all products. You can use this as a monitoring dashboard for very large network systems, spanning multiple campuses, buildings, data centers, homes, and retail environments with thousands of devices. All of the same root-cause analysis features apply here as well:
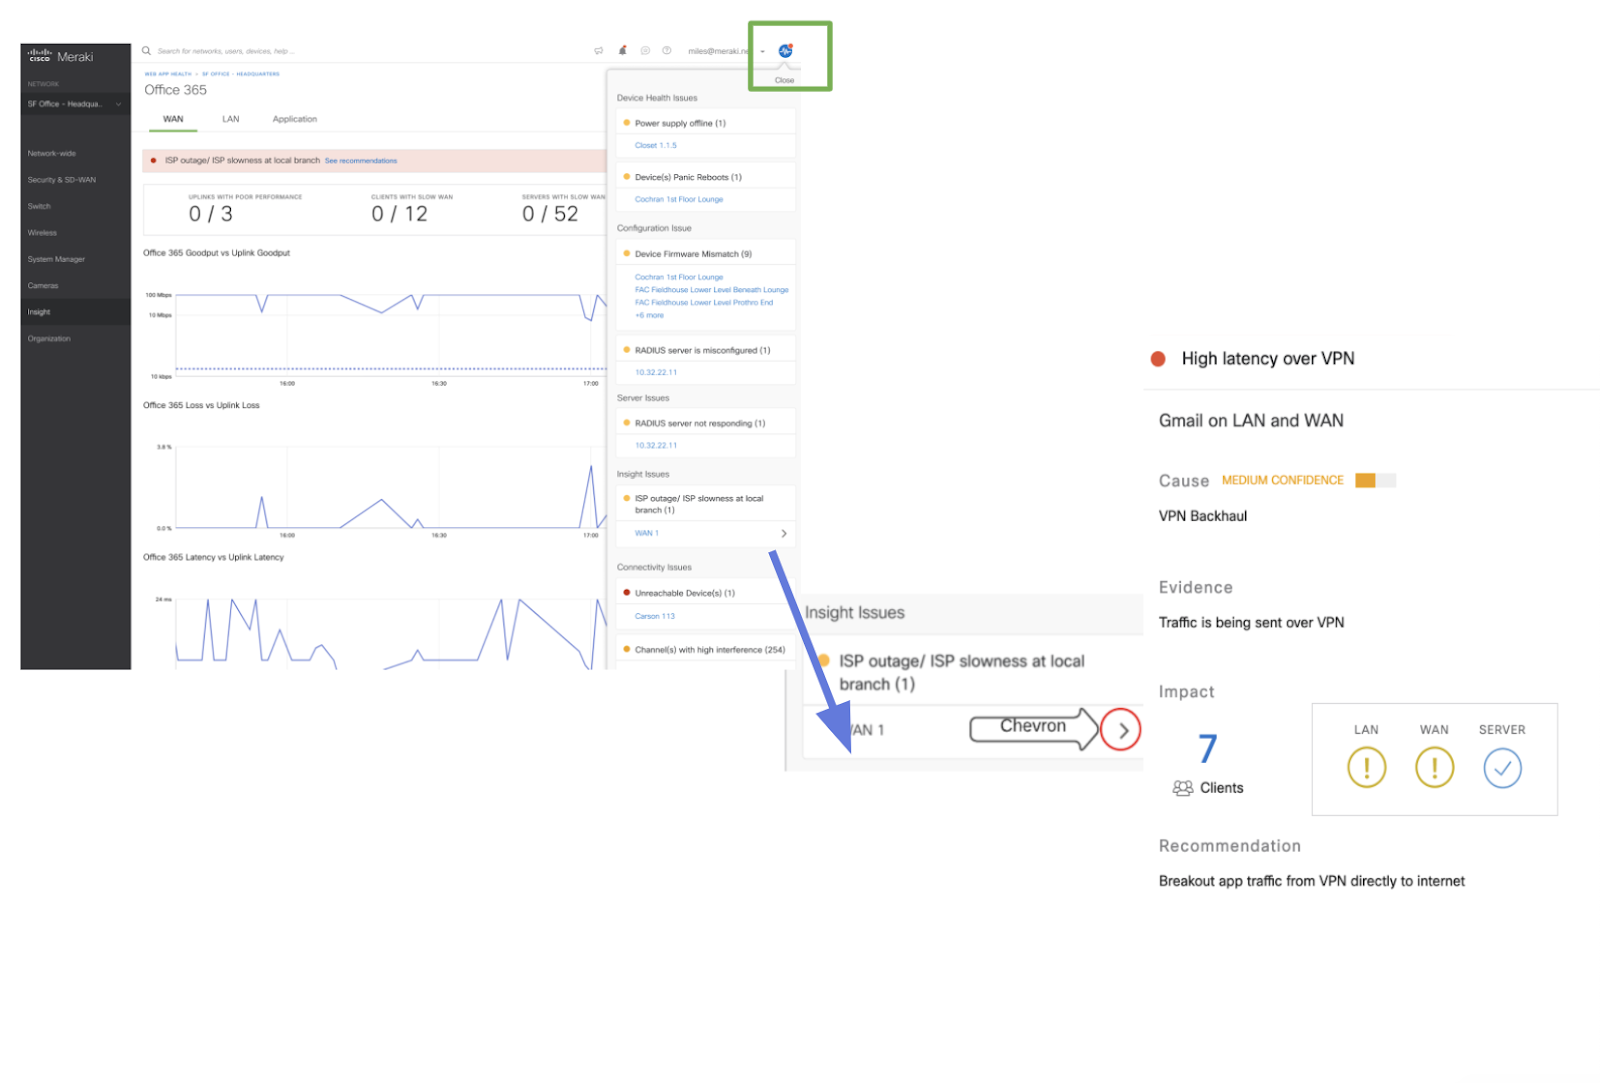
Meraki Alert Hub
Alerts from the Alert Hub can also be customized and aggregated through more efficient channels, such as email. You can configure all RCA alerts and analysis events to come through email notifications to your network operations center or network technicians. These come in a very intuitive format that calls out the application in question, the severity of the issue, and the opportunity to dig in and take immediate action. If the alert was unnecessary, engineers can easily adjust their settings by clicking the links in the notifications:
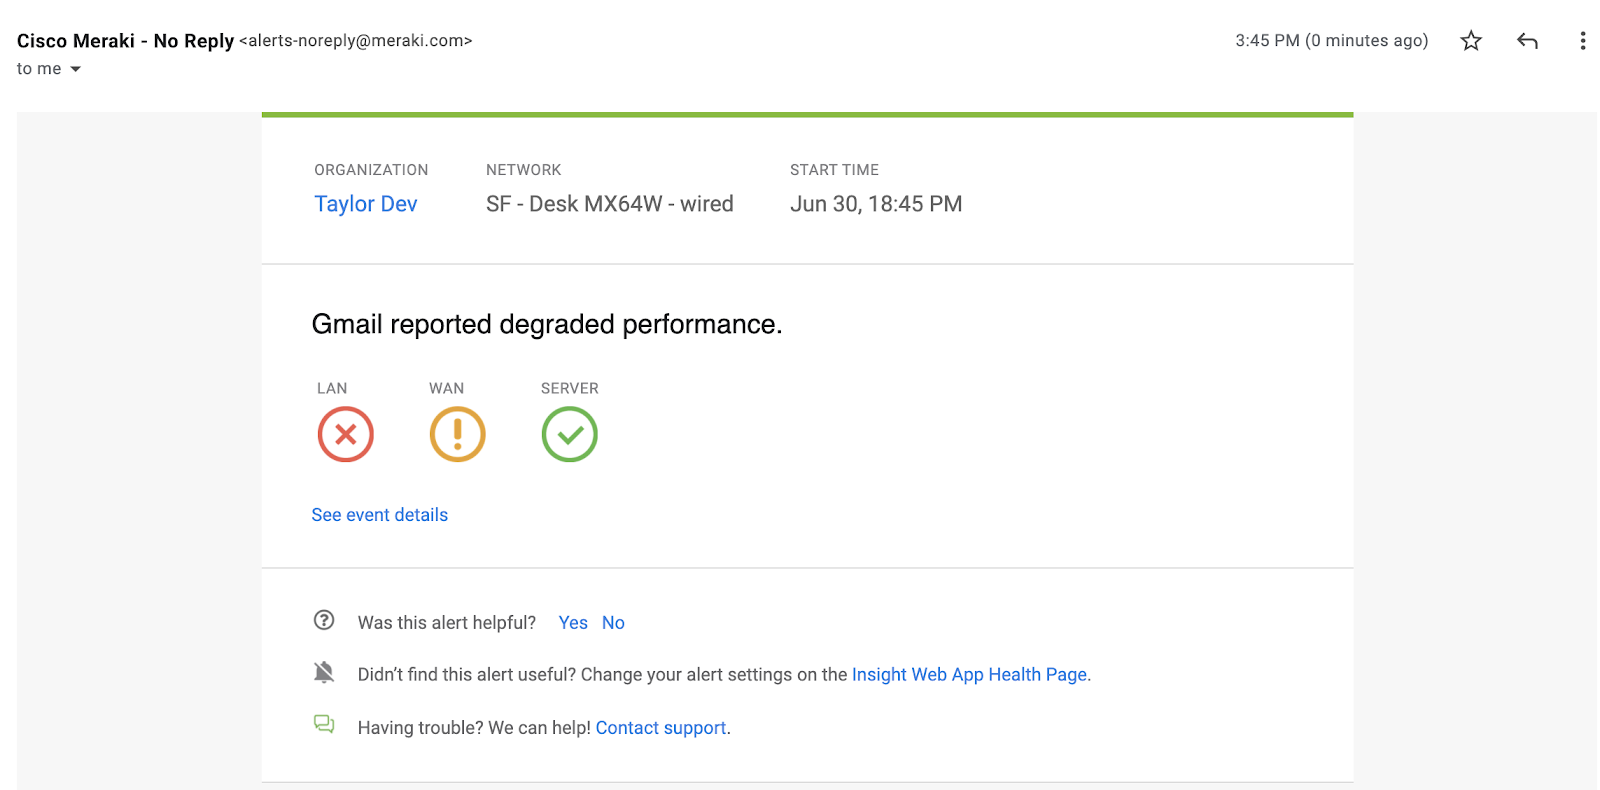
Email-based Meraki RCA alert
Final Thoughts
Cisco Meraki is changing the way IT teams work and manage networking services for businesses. The direct-to-device management styles that have worked for us for so long are now antiquated in the new era of hybrid work and work from anywhere.
The Meraki platform not only streamlines the management of critical network infrastructure devices but also provides actionable and data-driven insights and recommendations. The result is a quick response time for outage events, less stress for network operations teams, and more stable and profitable businesses.
delivered to your inbox.
By submitting this form you agree to receive marketing emails from CBT Nuggets and that you have read, understood and are able to consent to our privacy policy.