5 Ways to Monitor Activity on Palo Alto Firewalls

To accelerate incident responses, Palo Alto firewalls offer intelligence about user patterns and traffic utilizing informative and customizable reports. Reports, logs, the dashboard, and the application command center enable you to monitor activity in the network.
You can monitor the logs while filtering the information to generate reports with customized or predefined views. For example, a user can utilize predefined templates for generating user activities like analyzing logs and reports for interpreting unusual behavior in the networks, and simultaneously a custom report on the traffic patterns.
The ACC and dashboard for the visually engaging presentation of network activities include charts, widgets, and tables to interact with while looking for important information.
In this post, we'll discuss five key ways to monitor activities and traffic on Palo Alto firewalls.
1. Using the Dashboard to Show Firewall Information
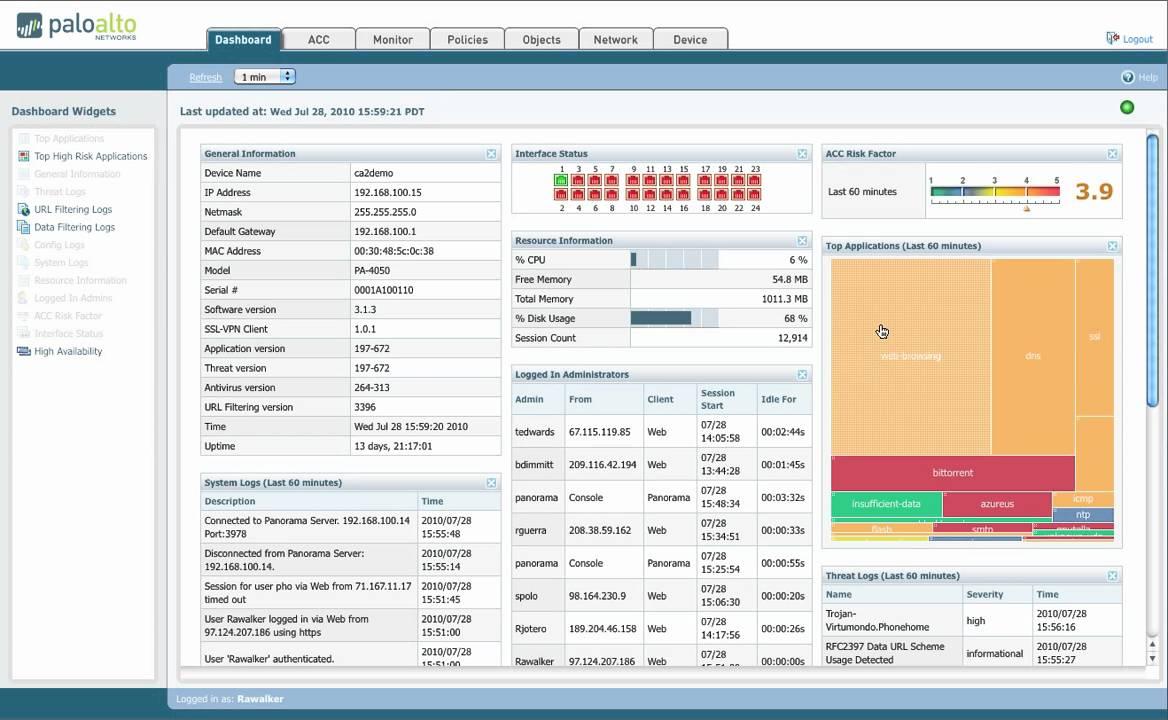
The tab widgets on the dashboard portray general firewall information like operational status in every interface, software versions, the utilization of resources, and the 10 most recent entries in the system logs, configuration and threats. All widgets available are displayed by default, but every administrator is capable of adding or removing widgets when the need arises. The refresh icon in the dashboard can be used to update an individual widget or the entire dashboard. Additionally, there can be automatic refresh intervals scheduled for 1-5 minutes periods.
The dashboard charts include top applications, top high-risk applications, general information, interface status, threat logs, configuration logs, data filtering logs, URL filtering logs, system logs, system resources, logged-in admins, ACC risk factor, high availability, and locks.
Top applications display applications with most session records with a security risk index that ranges from lowest (green) to highest (red). Top high-risk applications display the highest-risk applications with most sessions.
With a dashboard, a user can see the model, firewall name, the application, the threat, PAN-OS software version, current date and time, URL filtering definition versions, and on-time length since the restart. Interface status indicates whether every interface is green (up), red (down), or gray (unknown state).
Threat logs display applications, threat ID, and date/time of the last 10 entry threat logs. Config logs, data filtering logs, URL filtering logs, and system logs record the last 10 entries or/and last 60 minutes.
System resources display data plane storage, management CPU usage, and session count established through the firewall. Logged in admins display session type (CLI or Web), source IP address, and session start time for every administrator currently logged in.
2. Viewing Traffic Patterns in Application Command Center
Application Command Center (ACC) refers to an interactive graphical summary of users, applications, threats, URLs, and content traversing the network. The command center uses firewall logs that provide visibility into various traffic patterns and also offer actionable information on threats.
The graphical representation allows you to interact with the data while visualizing the relationships between events on the network as a means to uncover anomalies or devise ways to enhance network security rules. Users wishing to personalize the view of the network can add custom tabs and include widgets with the information most significant to the user.
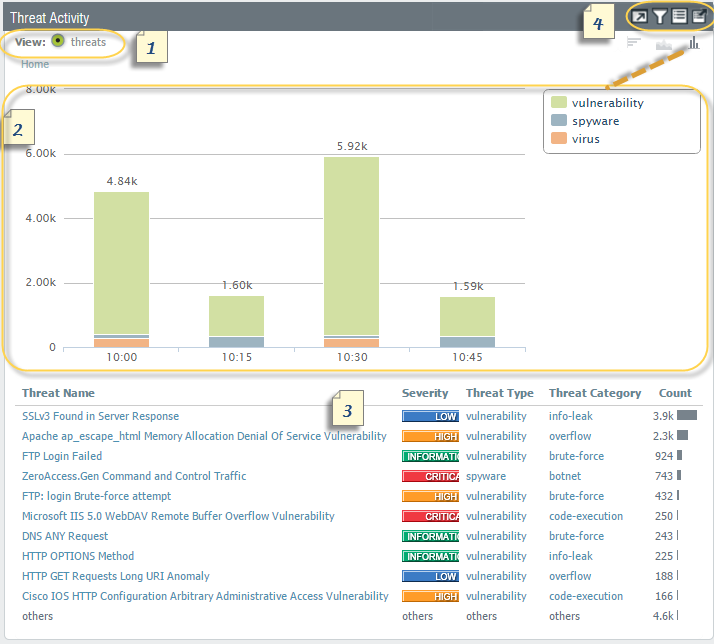
ACC includes many different sets of widgets including network activity, application usage, user activity, source IP activity, and destination IP activity. And this is just the start of the list!
With the help of ACC, you can utilize firewall logs to see network traffic patterns. It offers three predefined tabs to view network traffic, threat activity, and blocked activity, widgets to drill down for each graph to see the details.
3. Using Automated Correlation Engine to Detect Actionable Events
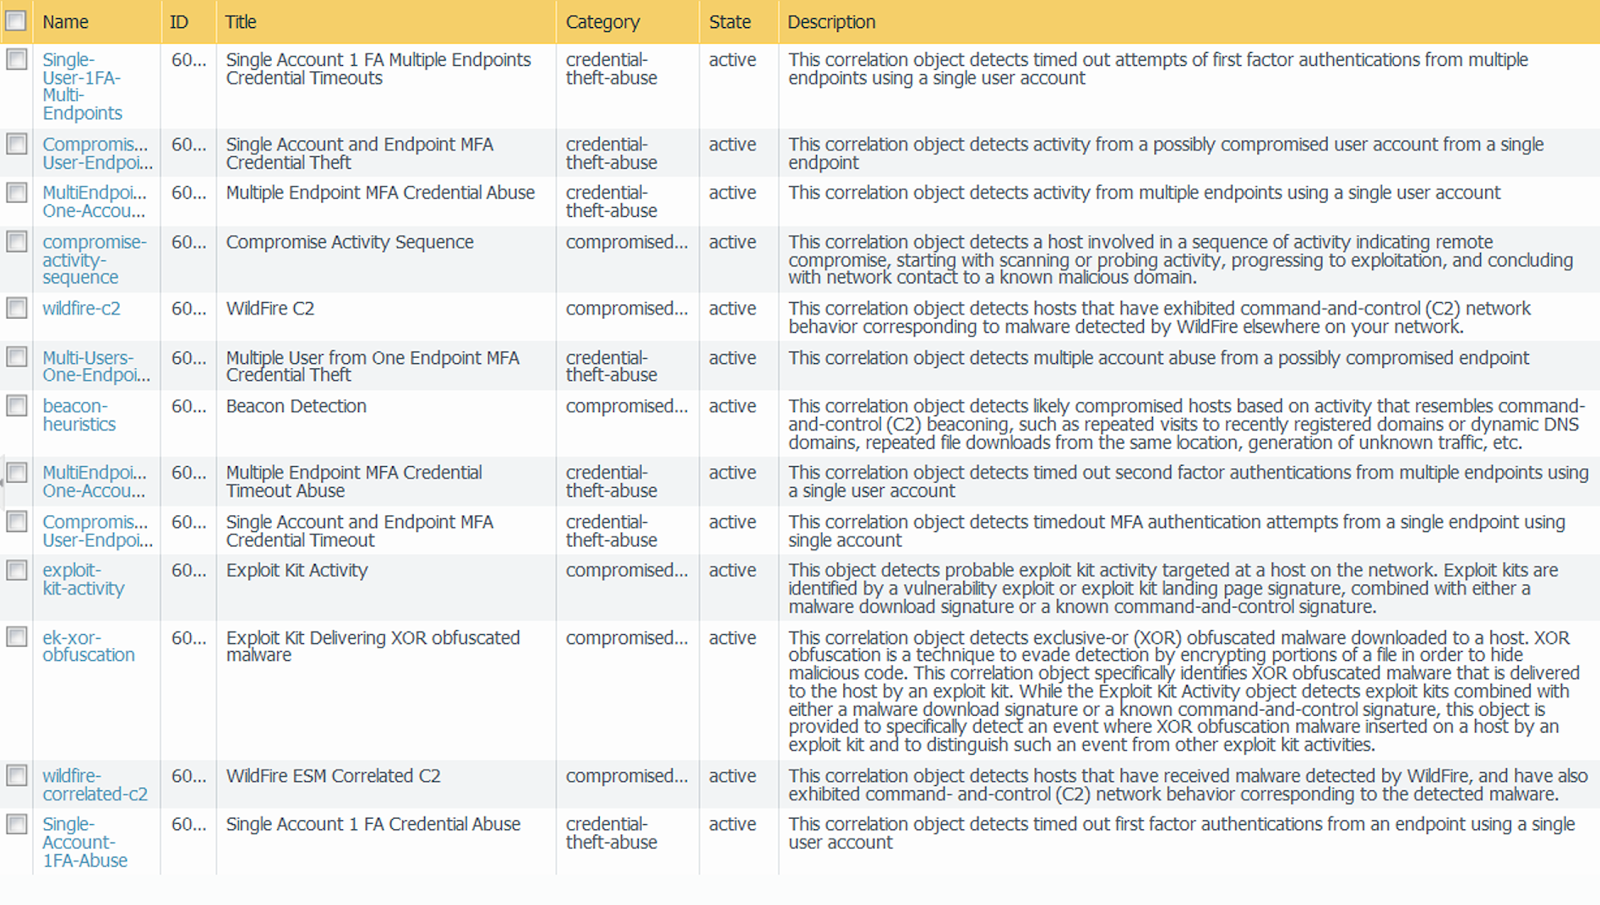
An automated correlation engine refers to an analytics tool that utilizes logs in the firewall for detecting actionable events in the network. The engine correlates a series of related threat events that when combined indicate a likely compromised host on the network or another conclusion. Automated correction engines pinpoint the various areas of risk like compromised hosts in the network which allows the user to assess the risk while taking action to prevent exploitation of various network resources.
The automated correlation engine is used to utilize correlating objects for analyzing the logs and generates a correlated event. Correlation events include match time, update time, object name, source address, source user, and severity. Match time refers to the time the correlation object triggered a match. Update time readers to the time when the event was last updated with evidence regarding the match.
The time stamp on the correlated event log is updated when the firewall collects evidence on the sequence or pattern of events defined in a correlational object. Object name refers to the name of the correlation object that triggered the match. The source address encompasses the IP address of the device/user on the network from which the traffic originated. The source user defines the user information from the directory server.
By using Automated Correlation Engine, a user can use firewall logs to detect actionable events to analyze any compromised host on the network that could be avoided.
4. Using Packet Captures to Inspect Data
Palo Alto Network firewalls enable users to take packet captures of traffic that traverses the network interfaces and management interfaces on the firewall. A user might need to disable hardware offload when taking packet captures on the data plane as a means to ensure that the firewall captures all the traffic. Packet capture can be CPU intensive while degrading the performance of the firewall. So, you should only use this feature when needed and then it off once the required packets have been collected.
Understanding packet captures requires you to know the various types of packet captures, disabling of the hardware offload, taking custom packet capture, taking a threat packet capture, taking capture packets for applications, and taking a packet capture on the management interface.
The four types of capture include custom packet capture, threat packet capture, application packet capture, and management interface packet capture. First, custom packet captures enable the capture of specific traffic based on the filters defined by the user.
You can configure the firewall to only capture packets to and from a specific IP address destination or port. The packet captures can be used for troubleshooting network-related issues.
Threat packet captures detect spyware, virus, or vulnerability. The feature is labeled in anti-spyware, antivirus, and vulnerability protection security profiles. The packet capture offers context around the methods used by the attacker and determines whether the attack was successful. Application packet capture is based on a specific filter defined by the user.
5. Analyzing Problematic Network Behavior With App Scope
App scope reports offer analysis and visibility tools to pinpoint problematic behavior, helping admins understand changes in user activity and identify network threats. App scope offers the ability to toggle attributes in the legend to view chart details under review. Clicking into an attribute in the bar chart drills into related sessions in the ACC.
App scope offers different reports such as summary reports that display top five gainers, bandwidth-consuming source, losers, and application categories for the last 60 minutes.
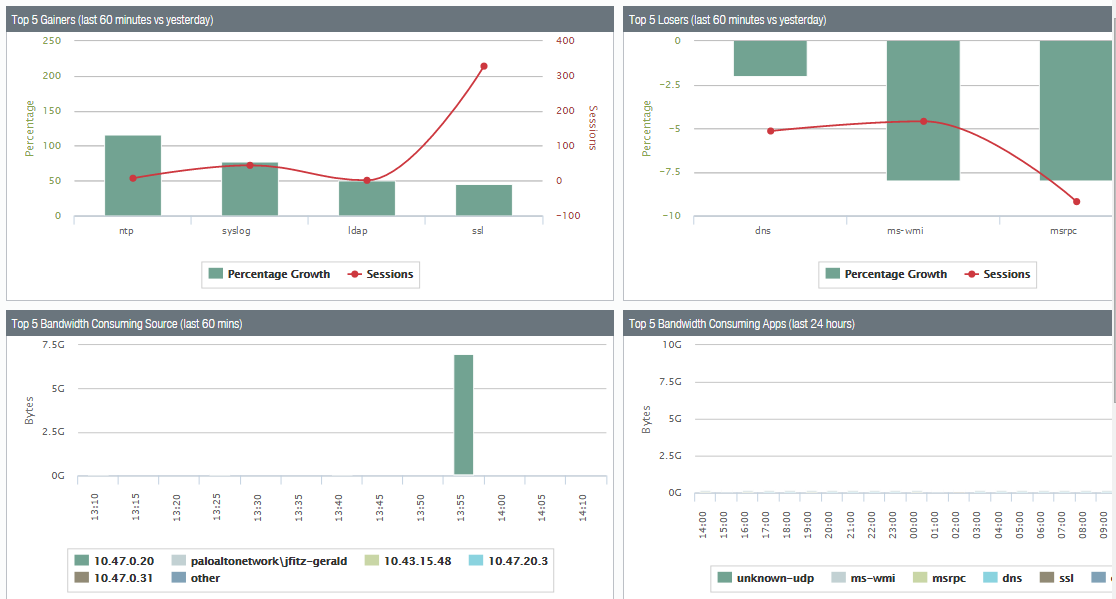
Change monitor report that displays certain changes that occurred at different time intervals.
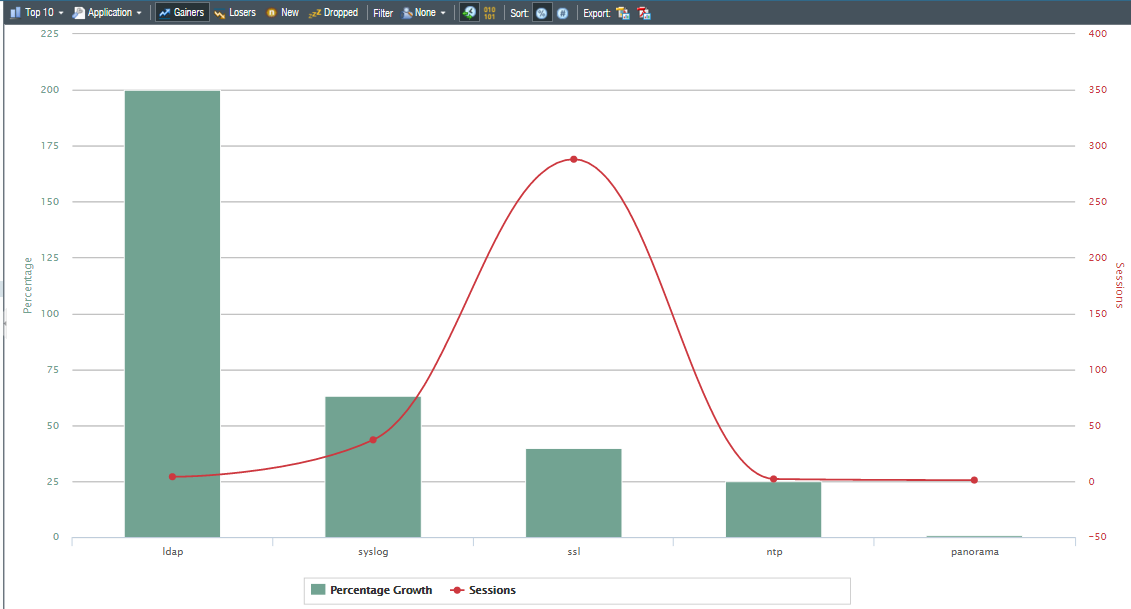
App scope also provides a threat monitoring report for counting top threats, a threat map report that shows geographical views of threats, a network monitor report that displays the allocated bandwidth used to perform different network functions, and a traffic map report that shows a geographical view of traffic flows as per sessions or flows.
Final Thoughts
Palo Alto firewalls are one of the best next-generation firewalls on the market. They are known for detecting known and unknown threats, including in encrypted traffic, using intelligence engendered across enterprise-level deployments by reducing risks and preventing attacks. You can monitor your network efficiently and confidently while deploying Palo Alto firewalls.
delivered to your inbox.
By submitting this form you agree to receive marketing emails from CBT Nuggets and that you have read, understood and are able to consent to our privacy policy.