What Cisco Meraki Dashboards Can Do For You

Cisco's Meraki platform can help you become a more efficient IT ninja in many ways. We have talked about the Meraki platform in general and taken a look at some of the dashboards. Now the question is, “What can the Meraki platform do to make life easier and improve performance?”
The answers, maybe not surprisingly, are nearly endless. Let’s look at a few key areas where the Meraki Dashboard and its features help you kick IT problems, become more proactive, and improve scalability, reliability and security.
Meraki's Data-Driven Network Operations
Most IT departments that support business-facing networks react to network outages by first receiving an in-person report from a user, or getting a ticket via email. At this point, it’s already too late. You’ve experienced a network outage that impacts your businesses’ ability to get work done and make money.
Additionally, the time to recovery is usually very long, because a user report does not include any information about the actual issue, only that there is something wrong. This is no longer acceptable, now that nearly all employees are working with a computer for some portion of their job responsibilities.
Enter, Meraki Dashboards and alerts for network management. Dashboards and alerts in Meraki help network teams power through issues before they happen and increase the time to recovery by providing actionable insights.
1. Dashboards
Meraki Dashboards are key for network operations teams managing multiple networks across many geographic areas. There are many causes for network outages, including loss of power, ISP connectivity, hardware failures, or even network loops and misconfigurations. The “View All Networks” Meraki dashboard shows network teams a view of every point of presence they manage, allowing them to see at-a-glance health for every network they are responsible for:
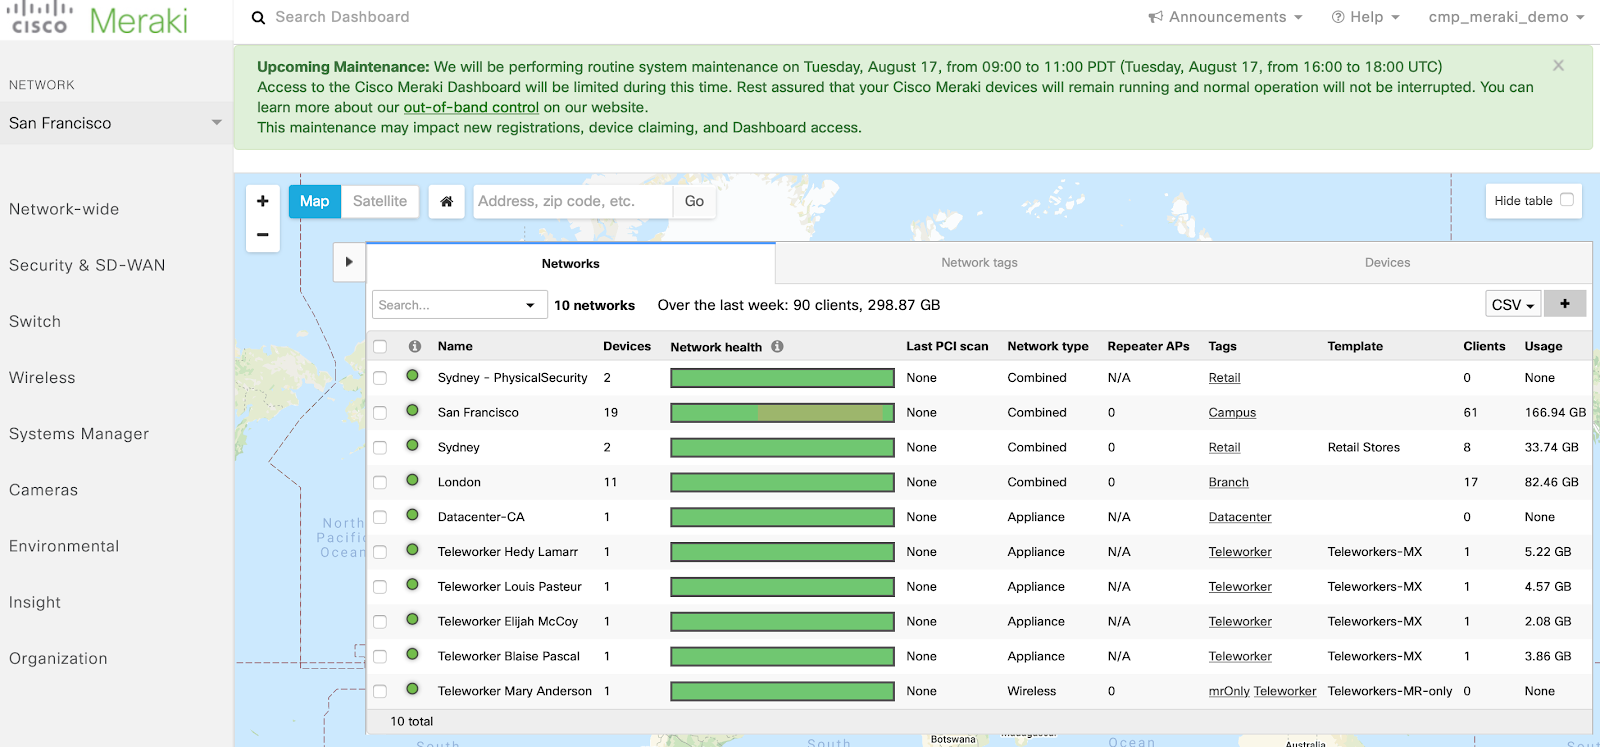
The network health bars on this dashboard turn red when a device is offline or some other issue occurs. A network admin can click-through this alert to drill into what the issue is, and then decide how to respond.
Without the Meraki dashboard to facilitate this type of monitoring, network teams would be configuring their own solution for centralized monitoring and alerting. There are many solutions for this, including PRTG, Prometheus, Grafana, etc. Most of these solutions would cost money (in either licensing or manpower, or both), time, and ongoing maintenance.
The reliability of a self-managed monitoring system is questionable, especially if it’s housed within a data center that you are monitoring. This further reduces the value proposition of a self-managed network operations solution. With the Meraki SaaS platform, all of this cost and operational burden goes away.
2. Alerts
Alerts solve the same problem as a dashboard for network teams, with the added benefit that they do not have to pay attention to a screen. Instead, you can configure email, SMS, or webhook-based alerts into Microsoft Teams, Slack, or other custom alerting systems to be notified of issues. This is great for smaller teams who have a lot of other systems to focus on, because they can work on more important things throughout the day, and still respond to the right issue at the right time, using data from the alert.
Because webhooks allow for limitless customizability, you could also configure automated systems for letting key business personnel know about network outages, including maintenance teams who might be responsible for power and cooling to network closets and data centers.
Meraki is Proactive Instead of Reactive
Many businesses operate critical network infrastructure in a completely reactive way. IT Teams often wait for hardware to fail before replacing it, neglect key software updates, never restart equipment, and have near-zero visibility into the infrastructure as it exists in the real world. This is because all of these tasks are very difficult to accomplish without a centralized monitoring and management plane for networks.
The Meraki platform notifies you in advance when hardware failures might occur, or when the hardware is becoming too old. Additionally, the visual network topology helps you see where all of their network hardware is, what it’s doing, and which devices are connected to it. Automated software updates dashboard and quick-access management tools for restarting equipment keep critical infrastructure up to date and working smoothly.
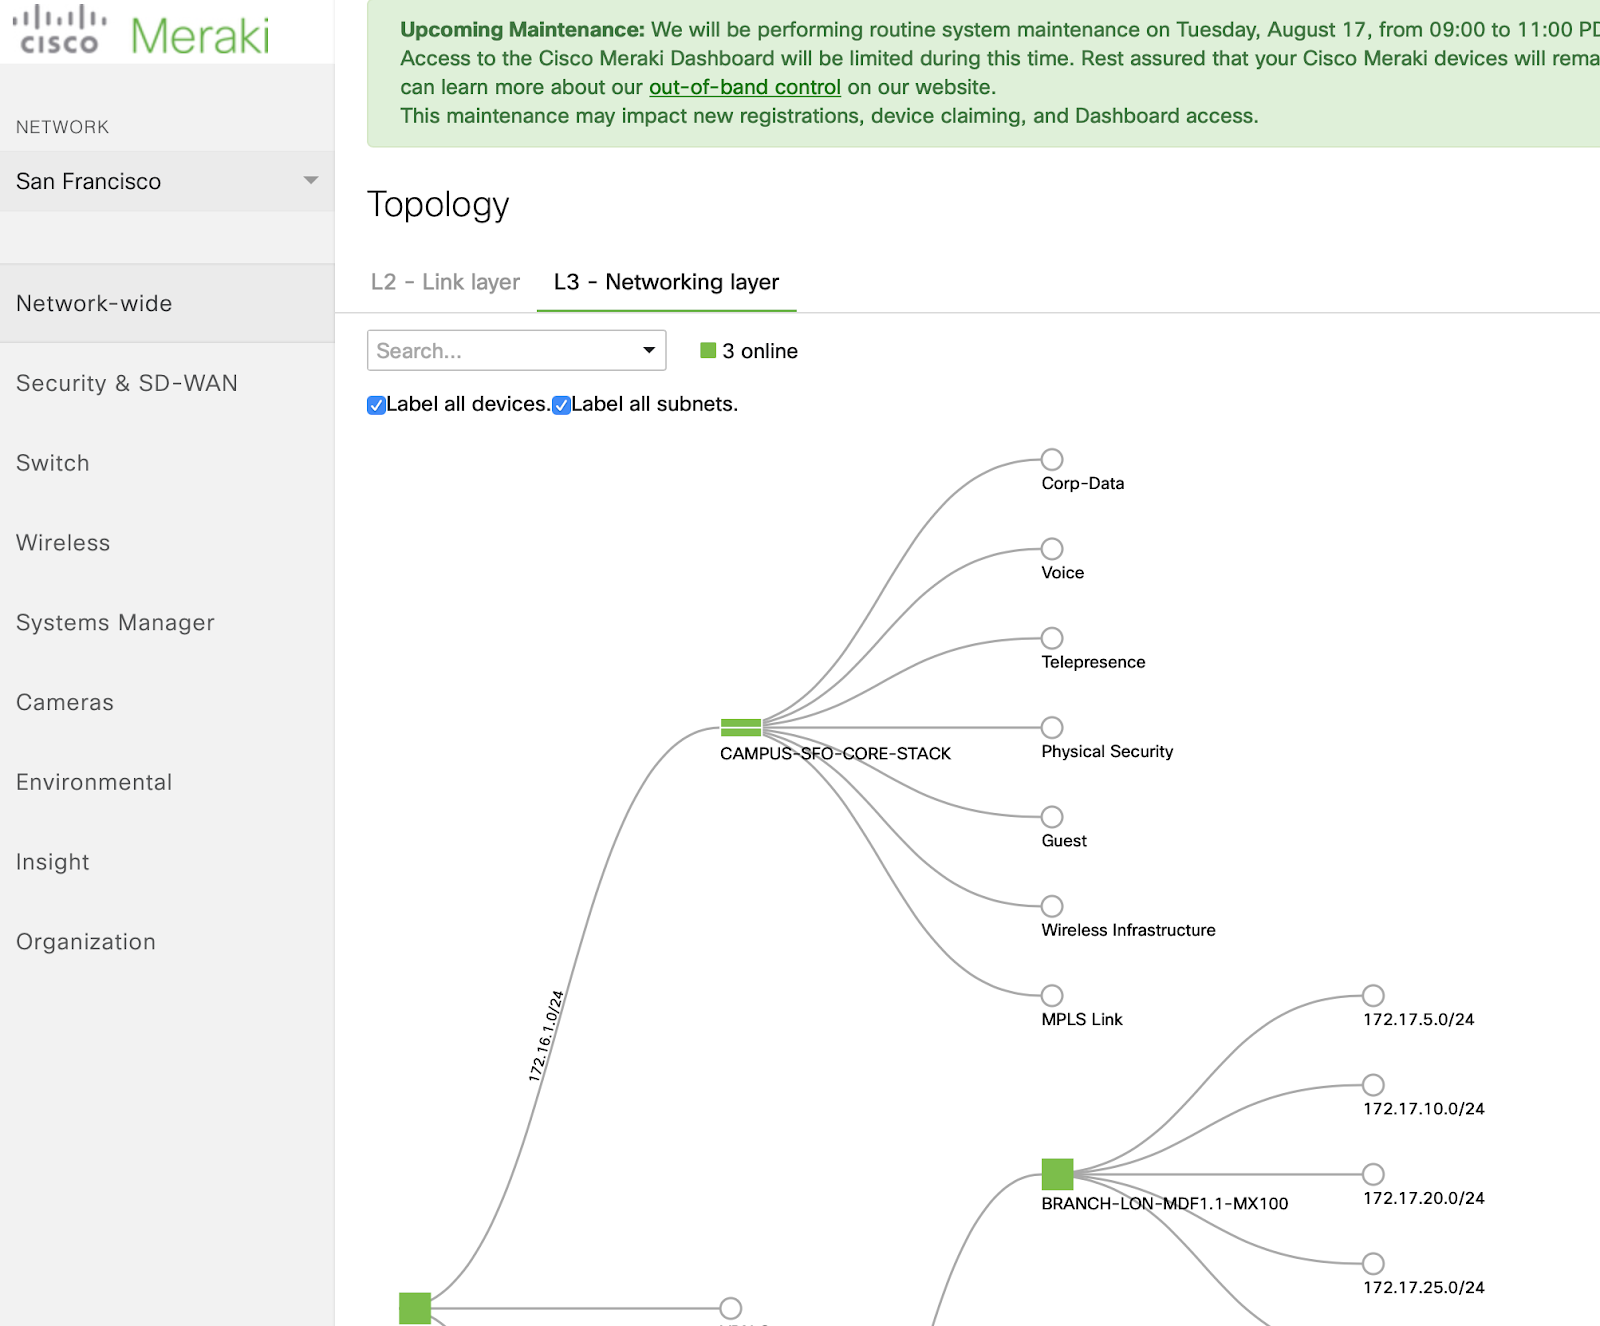

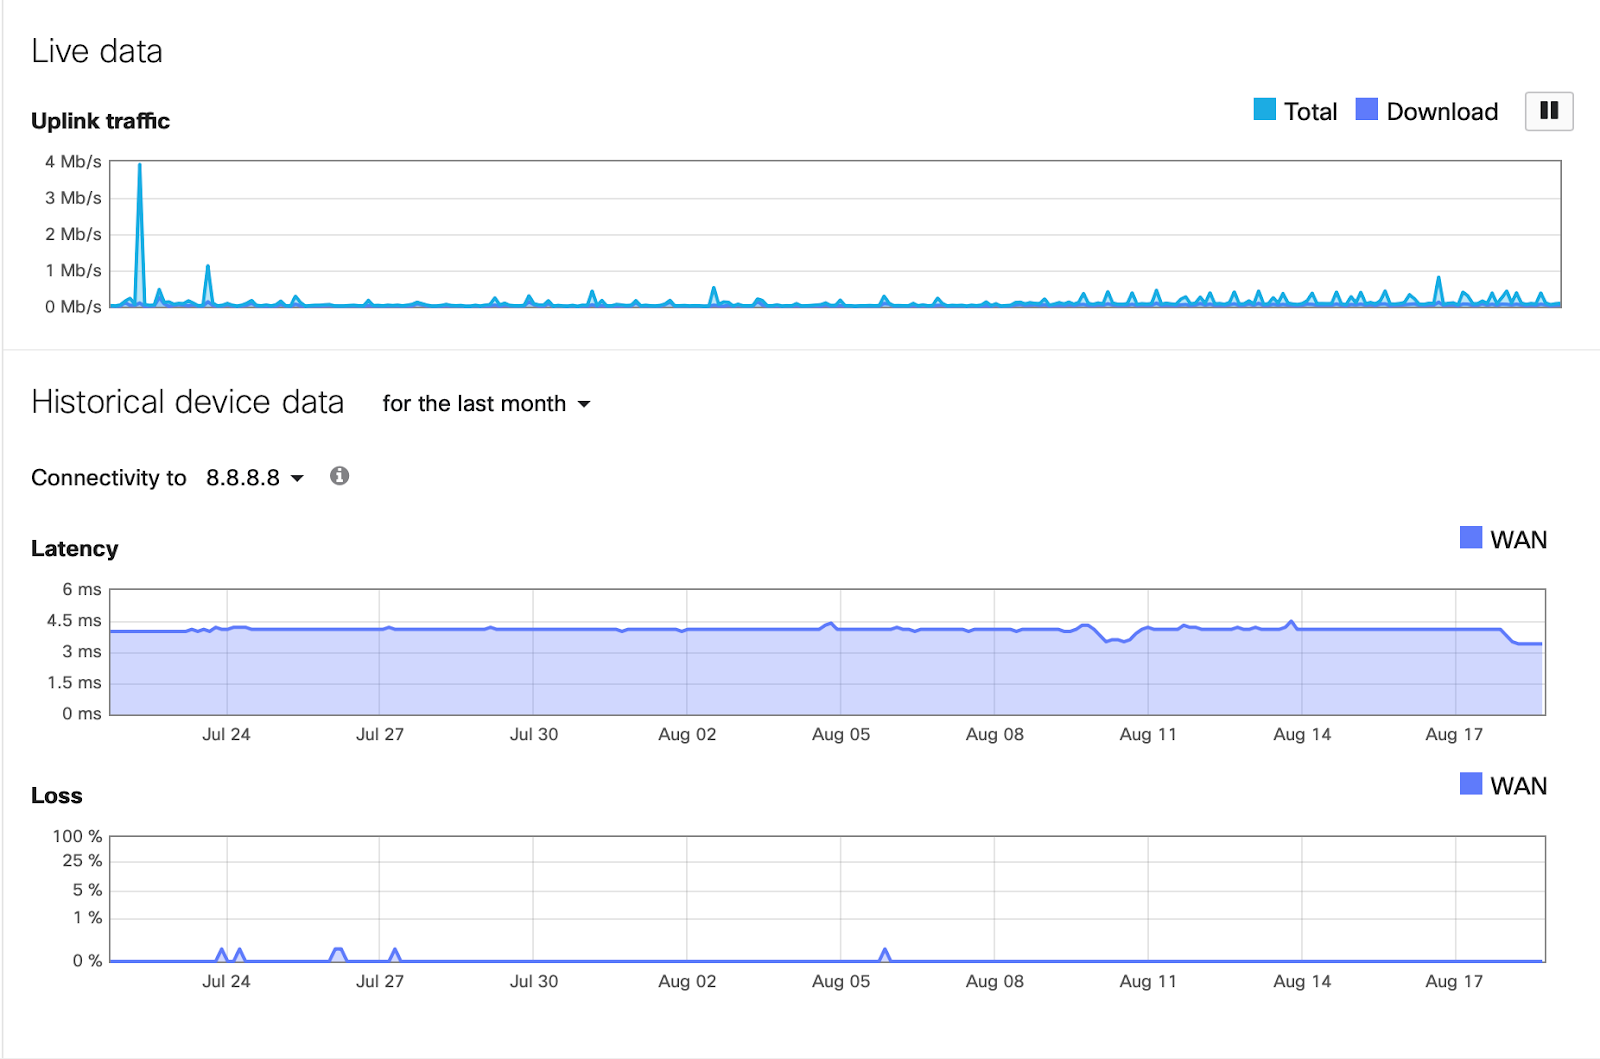
All of these features come together for you as a network admin to proactively update, replace, service, and respond to issues with your network infrastructure. These dashboards also give you real-time and historical insights into WAN connection performance, including wireless WAN/LTE backup connections. This WAN uplink status dashboard can be seen in the Security & SD-WAN -> Appliance Status -> Uplink section.
Network Settings as Policy With Meraki
A very common challenge I have as a network admin is applying policies to the network across devices within a building or distributed network. This is extremely difficult to do with SSH or on-box management tools, as all of your access control lists, traffic shaping rules, and failover configuration must be configured on a per-device basis. The Meraki Dashboard allows you to create policies that are applied automatically to classes of devices, devices that are tagged with a tag you specify, or across different types of WAN connections, to ensure that your network clients experience consistent results.
Centralized management of these policies with Meraki eliminates human error, ensures that all of your network devices’ configuration is up to date, and allows you to see the results of your policies within minutes. A common example in today’s modern workplace is the use of video and audio conferencing on corporate networks. This type of network traffic is very sensitive to latency and bandwidth constraints, so it is important that the switches, routers, and firewalls within a corporate network all implement traffic-shaping rules which prioritize voice and video traffic over other latency insensitive traffic. This can be done very simply with two policies in the Meraki Dashboard, which then apply the configuration to all devices within your network.
Security & SD-WAN -> SD-WAN & Traffic Shaping:
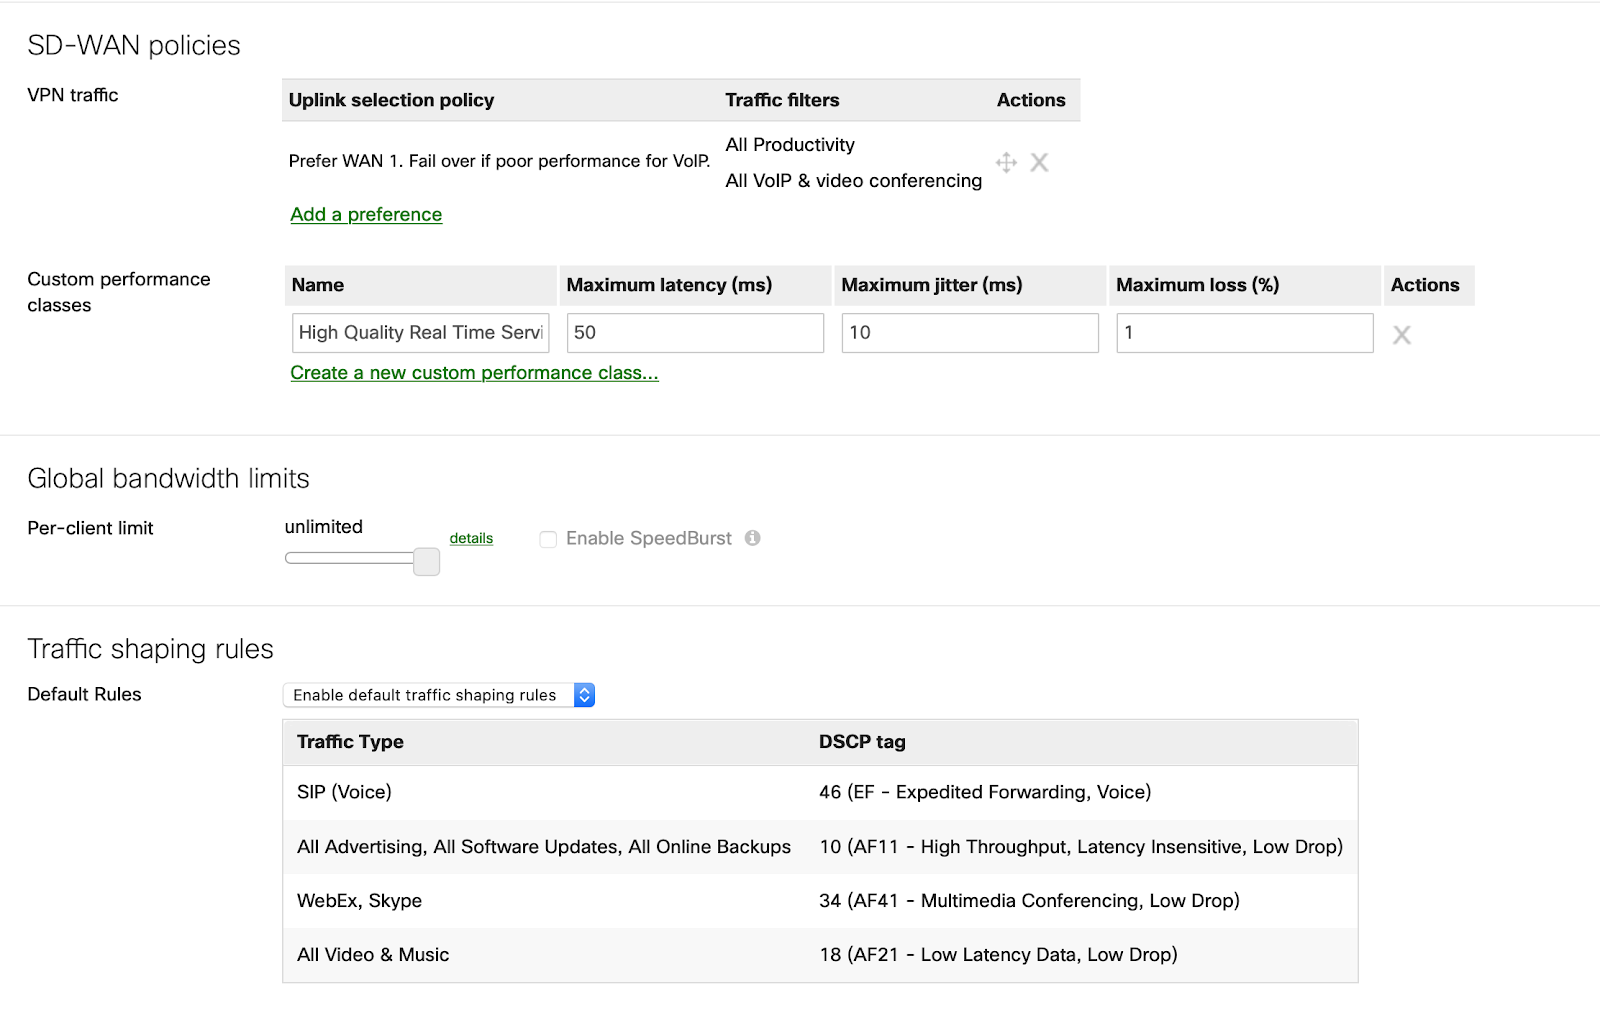
Here, SIP and voice traffic is prioritized over other latency-insensitive types of traffic. Additionally, a low-latency and high-bandwidth link are prioritized with an SD-WAN policy, ensuring this real-time traffic is sent over the internet connection most suitable for the task. Once set, this policy applies to all security appliances (router/firewalls) within the Meraki network, including replacements from failure, and warm-spares in a highly available configuration.
Quality of Service settings for Switches
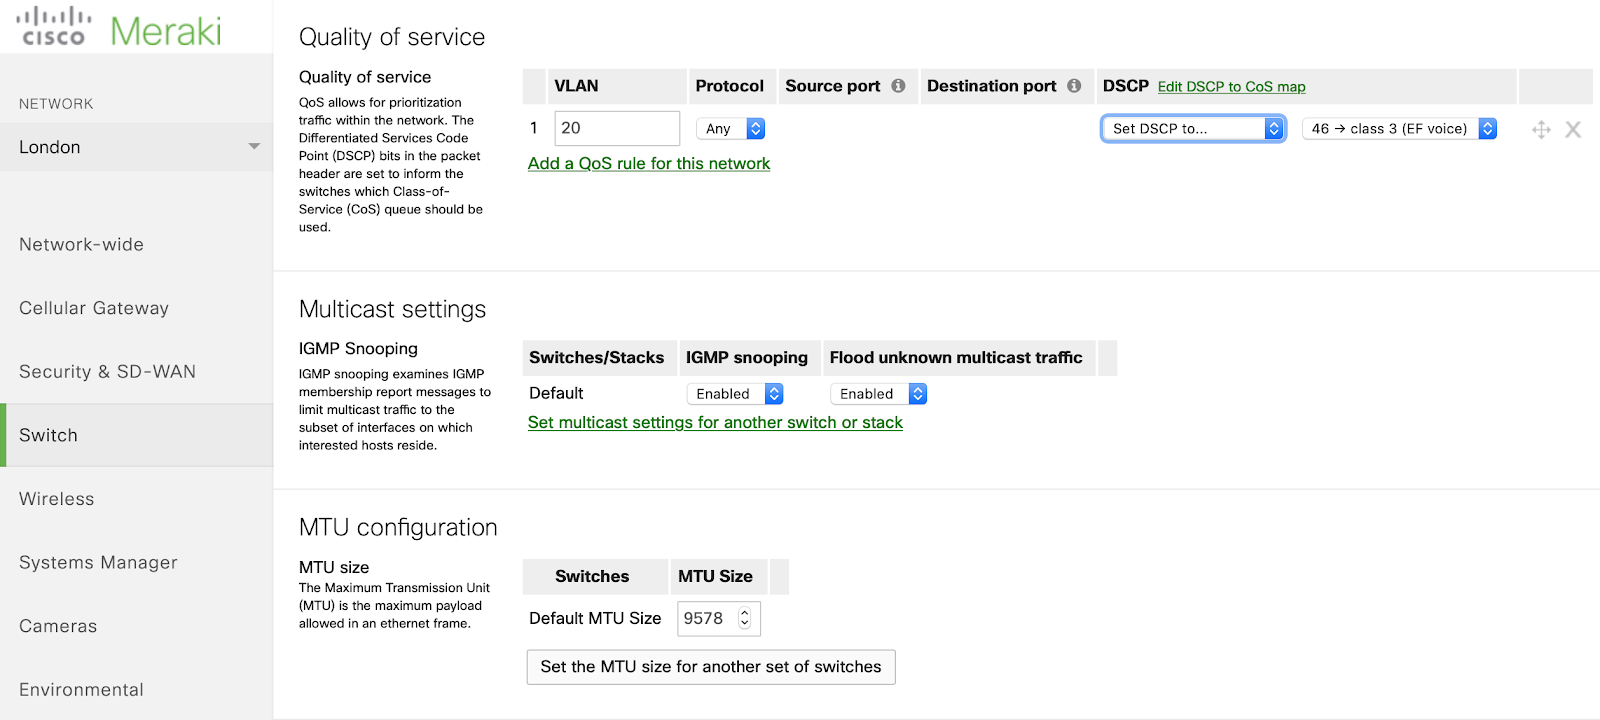
In the Switch -> Switch settings section of the Meraki Dashboard, you can configure QoS policies that will apply to all switches. You can opt to either trust the incoming differentiated services code point (DSCP) value, or specify a specific rule for a particular set of VLANs. Here, the voice VLAN is being configured with a voice traffic prioritization policy. Every switch in the Meraki network will receive this policy setting, and you can know as a Network admin that voice traffic is being prioritized on your network. This same method can be used to apply Quality settings for Microsoft Teams, Zoom, and others.
Use Templates to Scale Out Quickly
We’ve talked a lot about how dashboards and alerts help network teams to be more proactive, topology dashboards help teams locate and service network hardware, and centrally managed policies ensure network performance. The Meraki Dashboard takes all of this one step further, making life even better for you. You can define network templates in the Meraki dashboard for quickly scaling out your networks.
If your company grows by acquisition, for example, you can create a network template that includes all of the standardized policies, alerts, tags, and Quality of Service settings for your branch networks. Then, when it’s time to implement a new network for a branch office, you can create the network from your template and claim your hardware devices in the portal.
All of your templated settings are applied automatically as your network hardware comes online. You can also use templates to update settings across all of the bound networks created from a template. Say, for example, you have to increase bandwidth limits across all of your branch office networks. Instead of connecting to each branch office router and applying the configuration, you update the parent template for those offices. Then your changes are made automatically across all of the networks.
Final Thoughts
The Cisco Meraki Dashboard can do so many things that help you be more effective, save time, and become more proactive. Dashboards and alerts help you stay aware of network operations, even while you are far away. Actionable insights in the Meraki dashboards allow you to drill in and identify the root cause of issues on the network, and visual topologies allow you to quickly identify what equipment is where.
Centralized management of settings and policies and the concept of network templates remove the need for repetitive, non-value-added work, and creates even more efficiency. What Cisco has made possible in the Meraki platform allows businesses to achieve a level of operational excellence that was never possible before.
delivered to your inbox.
By submitting this form you agree to receive marketing emails from CBT Nuggets and that you have read, understood and are able to consent to our privacy policy.